The Activity Diagram shows the sequence of tasks carried out in a process and how these tasks are interconnected.
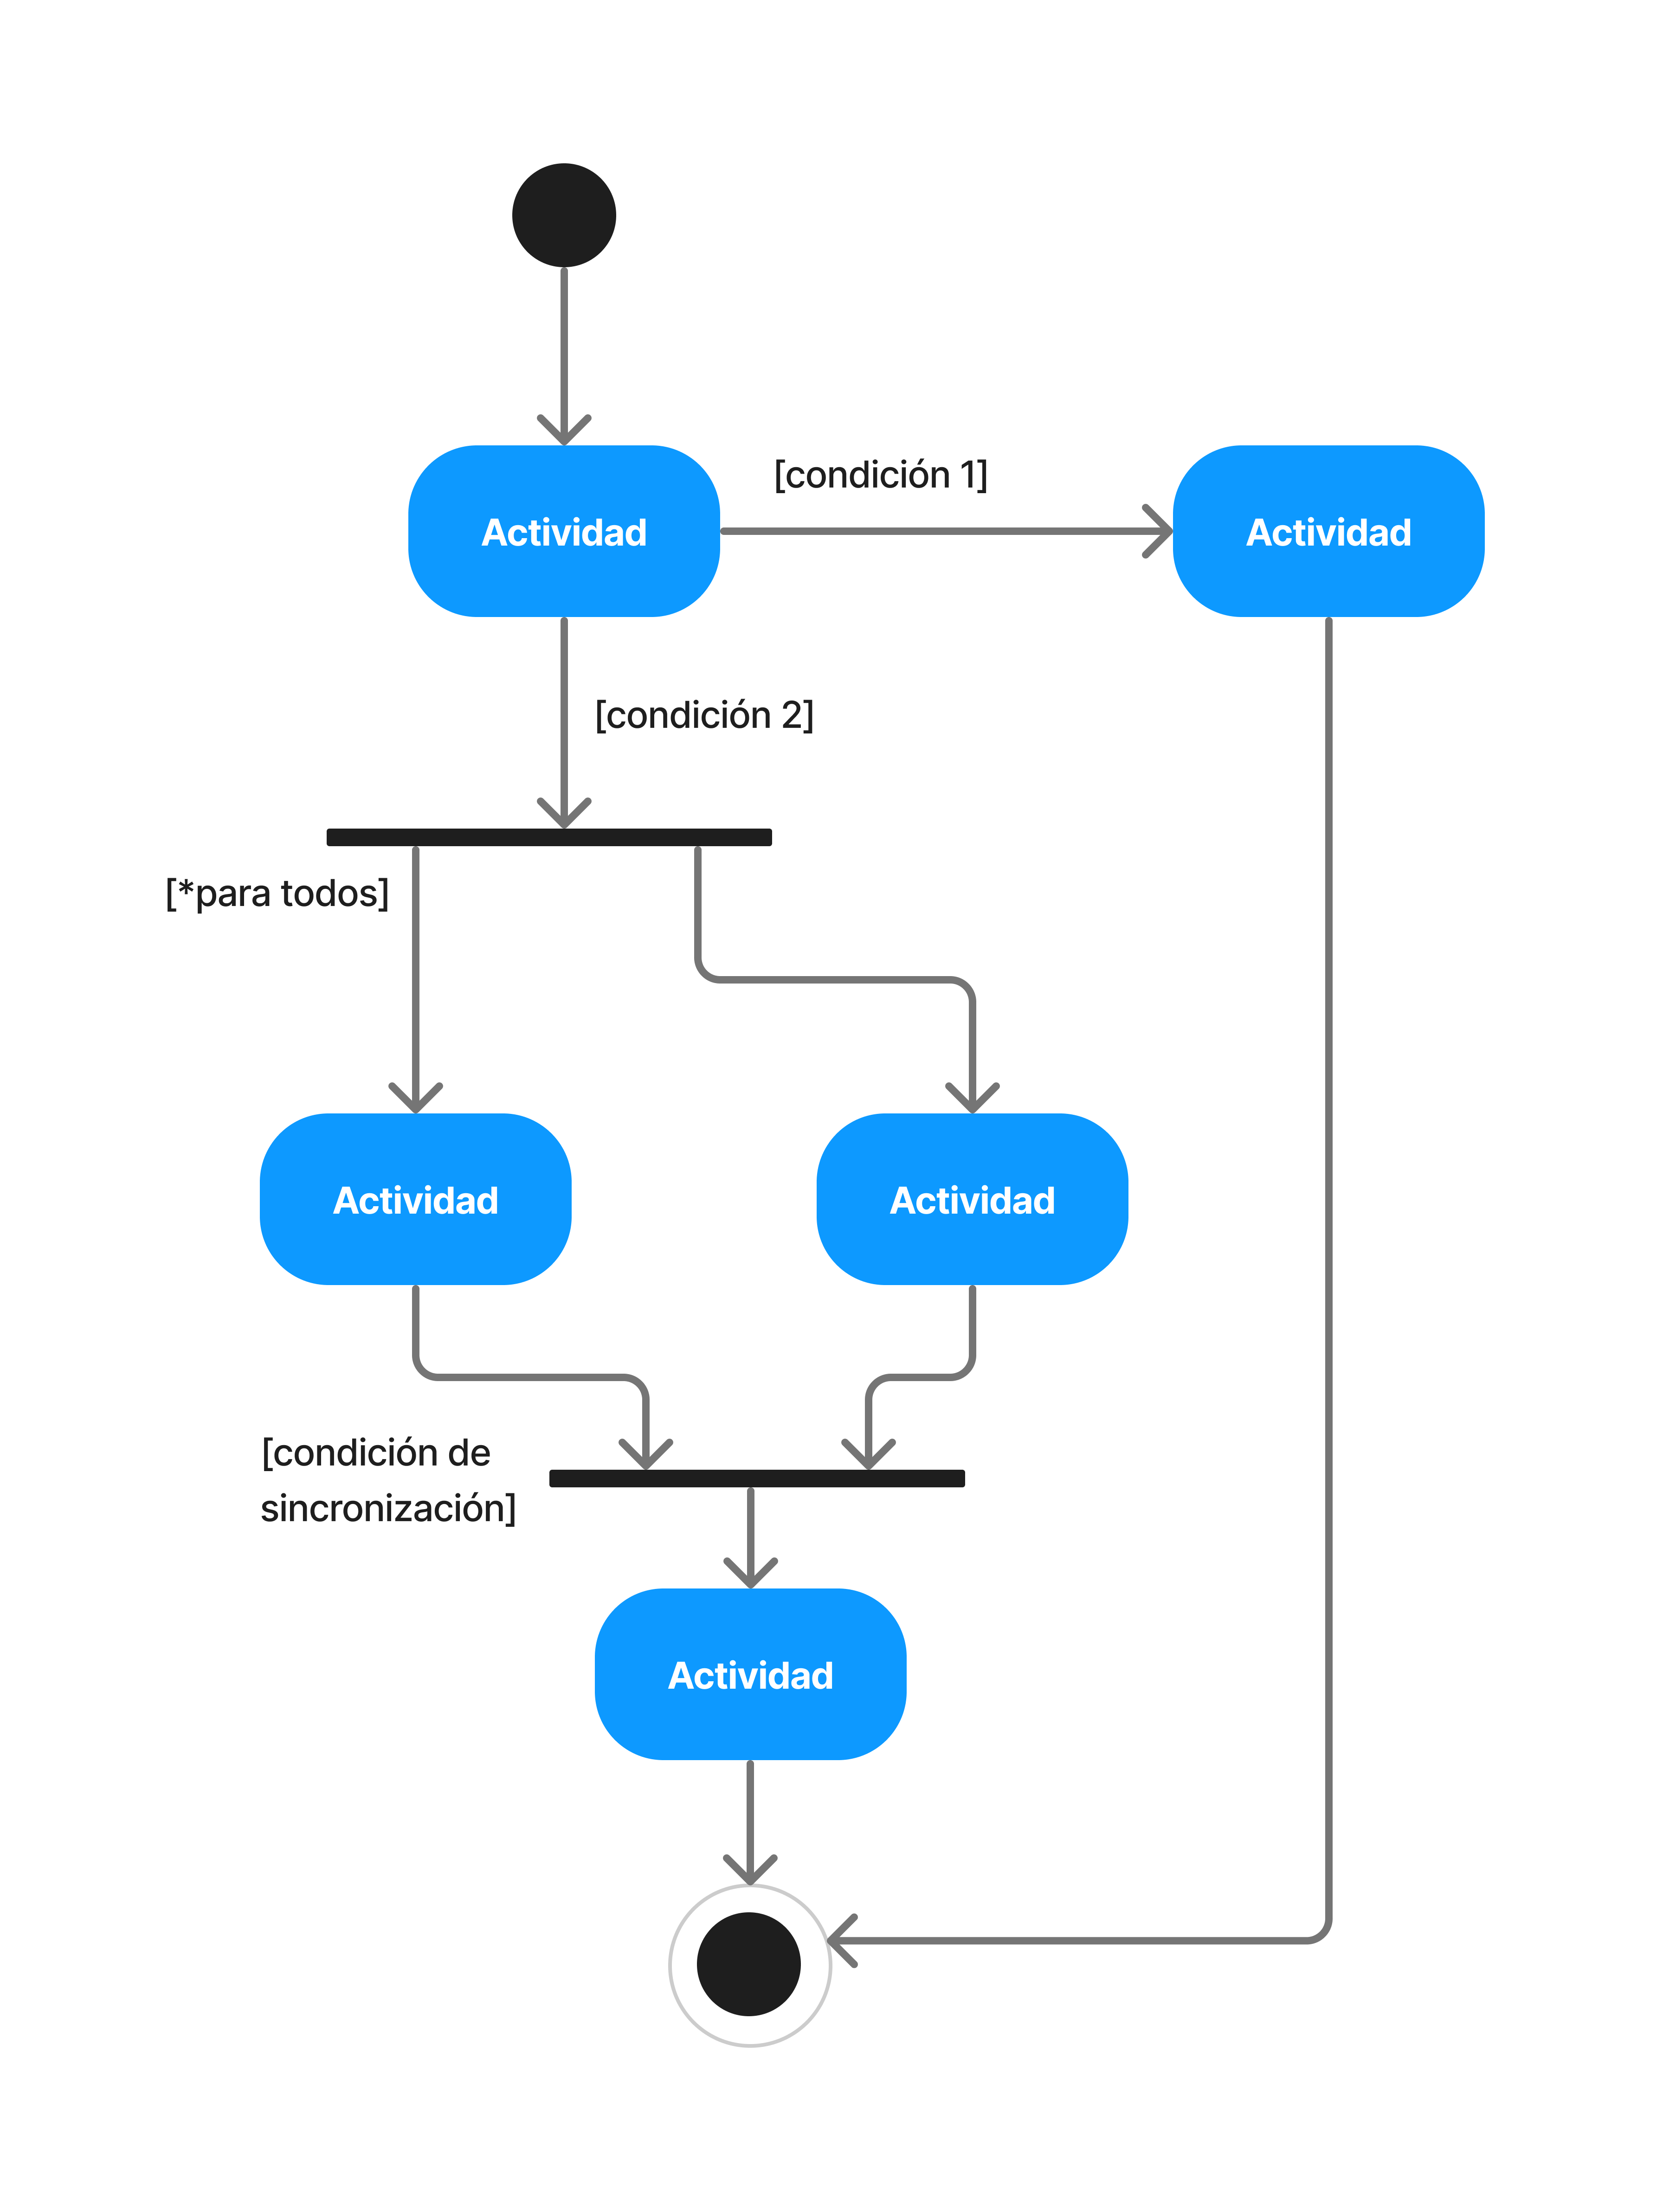
# Key Components
-
Activities: Tasks or functions (rounded rectangles).
-
Transitions: Arrows showing the control flow sequence.
-
Decisions: Diamonds that fork the flow based on conditions.
-
Start and End: Filled circle and circle with a border, respectively.
-
Concurrency: Horizontal/vertical bars for parallel processes.
# Example: Getting a beverage
The following process describes how to get a beverage from a machine (coffee or juice) based on availability:
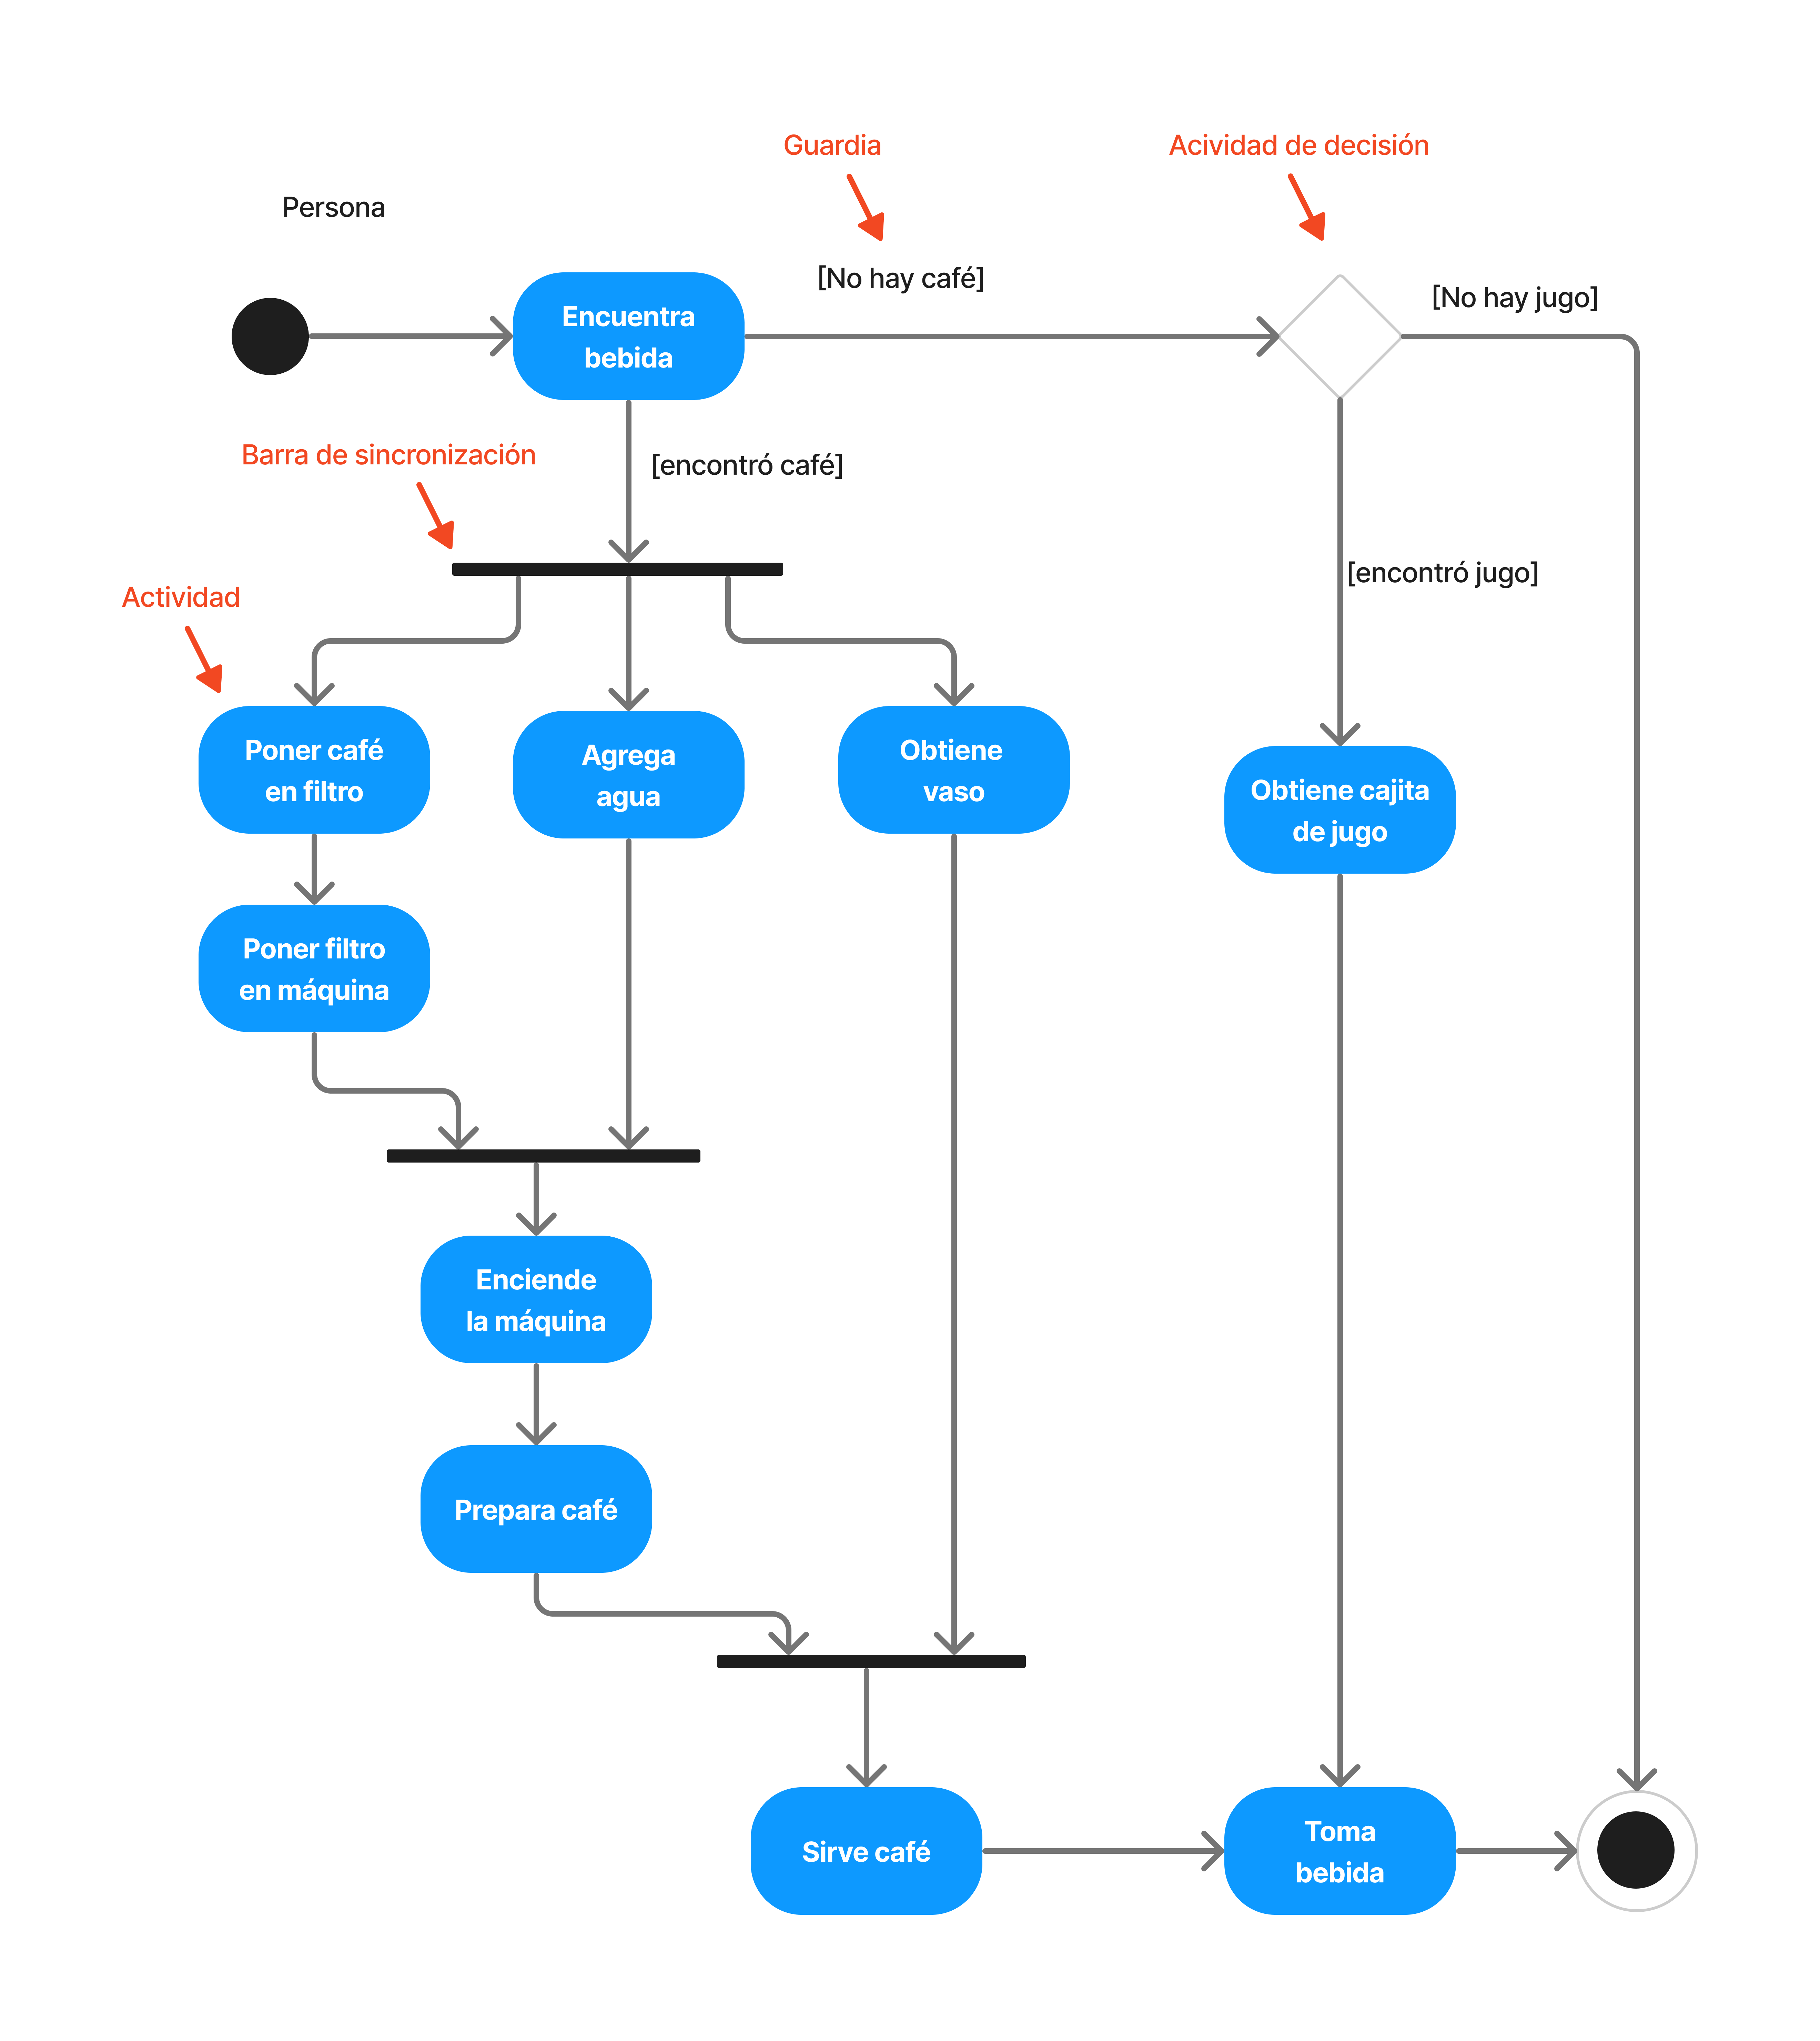
Flow analysis:
- Initial decision: Forks based on
[Coffee available]or[Coffee not available]. - Parallelism: In the coffee branch, concurrency is shown (putting in the filter and adding water at the same time).
- Synchronization: Parallel tasks must be completed before turning on the machine.
- Alternative: If there's no coffee, it looks for juice; if there's no juice, it ends.
# Purpose
-
Model business processes and workflows.
-
Visualize the logic of complex methods in programming.
-
Optimize processes by discovering inefficiencies.
# Advantages
-
done_all
Total clarity on how a process develops.
-
done_all
Versatility (software, teaching, production).
-
done_all
Facilitates communication between roles (devs vs. analysts).
# Conclusions
The Activity Diagram is useful for the graphical representation of processes and workflows, providing a simple visualization of activity sequences and decisions within a process.
These diagrams are important in the planning, design, and optimization of processes in a wide range of applications, from software development to business process modeling.